Prediction and Explanation in Social Sciences: Introducing a Set of Useful Methods
During my Ph.D. studies, I have noticed a growing number of methods we can learn to answer research questions in social sciences. The area of computational social sciences has mixed complex social systems problems with advanced statistical and computational techniques, allowing researchers to answer questions that would otherwise be impossible to answer. The amount of information generated by social media users is immense; therefore, without big data methods to extract and transform data and the computational power to analyze massive social networks, the study of this kind of phenomenon would be very limited. In this context, scholars have pointed out the importance of understanding how these new tools might improve the quality of research in social sciences by differentiating how to use them to explain or predict problems of interest (Hofman et al., 2017). This is the initial post of a series I am publishing to describe a set of methods I have studied and collected from different sources; the idea is to make the material available in one place. The selection you will find in this blog does not pretend, by any means, to be exhaustive; instead, its purpose is to serve as an introduction for researchers of social sciences interested in learning analytic tools that can be used to infer predictions or cause-effect processes.
This initial post contains a review of the concepts of prediction and explanation. I use the classification, based on statistical modeling, made by Shmueli (2010) to explain the differences between how we model both concepts. These differences are based on their scientific goals: empirical prediction and causal explanation. Using Shmueli’s classification and adding the vision of social scientists about how prediction and explanation have been studied so far, I try to generate a common ground to understand why the analytical techniques I explain in later posts can be helpful for explanations or predictions. The classification made by Shmueli (2010) distinguishes between explanatory modeling and predicting modeling. Also, it adds the notion of descriptive modeling that is useful considering the state of the art in social sciences.
Explanatory modeling refers to statistical methods used to test a causal theory. In this case, researchers, based on their knowledge of the subject under study, elaborate theoretical models applied to the data to be tested. I acknowledge that causality is a complicated concept to define. We can find definitions from Aristotle, who proposed that there are four fundamental elements to answer the question “why?” (cause) -material cause, formal cause, efficient cause, and final cause- until more recent efforts from social scientists such as Henry Brady (2011) whom based on a revision of philosophy and statistics states that causation should satisfy (1) constant conjunction of causes and effects, (2) the absence of effect when the cause is not present or counterfactual analysis, (3) the presence of effect after a cause is manipulated, and (4) the activities and processes linking causes and effects should be explained by a mechanism. However, even though there is no consensus about a definition of causality, for the type of analysis described here, the notion of causality is given by the theoretical implications specified in the model. Shmueli defines “explaining as causal explanation and explanatory modeling as the use of statistical models for testing causal explanations.” A powerful technique to test causal explanations is the framework developed by Judea Pearl called Structural Causal Modeling; it will be reviewed in detail in one of the following posts of this series.
To illustrate how social sciences develop explanations, let us consider the diagram in Figure 1, elaborated by Chaffee (1991), to represent explanations as an iterative process in Communication.
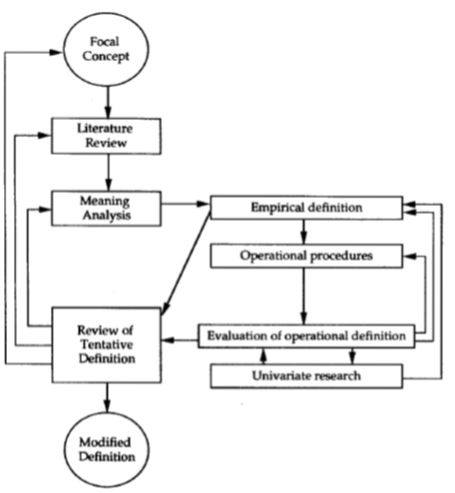
Figure 1
We can observe that the idea is to elaborate a meaning analysis that creates theoretical constructs rather than measurable variables. Typically, these constructs represent an explanation of the phenomenon analyzed via a diagram that shows the causal relationships between them. Because constructs are abstractions, researchers need to establish connections between these and reality. The link between constructs and observable measurements is called operationalization. Once the operationalization is done, measuring the variables of interest is possible to generate the data needed to evaluate the research hypothesis in a statistical model. In summary, explanatory modeling refers to “applying statistical models to data for testing causal hypotheses about theoretical constructs.”
Predictive modeling is defined as “the process of applying a statistical model or data mining algorithm to data to predict new or future observations.” The idea is to predict an output value given the input values. This is clear for time series analysis when we try to forecast values in the future \( (t+k) \) based on previous observations.
The concept of prediction in social sciences has been historically ignored because scientists’ efforts have concentrated on finding causal explanations for social phenomena. But recently, scholars like Hofman, Sharma, and Watts (2017) have argued that the new tools provided by the current computational nature of social science should help consider a more extended use of predictions in the field. For the proper incorporation of prediction, the authors highlight three critical problems that must be addressed. First, it is necessary to define standard measures for prediction. These measures will improve the comparability of results by establishing consensus on the problems to be solved. With a set of specific problems defined, a “common task framework” should help evaluate claims about prediction. In the absence of common tasks and data, researchers must clearly differentiate between exploratory and confirmatory analysis. Second, theoretical limits to prediction must be better characterized; this way, it is possible to set expectations of what can be predicted or explained. It has been shown that there are events intrinsically impossible to predict in a meaningful sense, meaning that the predictive accuracy is subject to a limit, and those limits need to be comprehended. Third, predictive accuracy and interpretability must be recognized as a complement to evaluate explanations. This is based on noticing that simple models do not necessarily generalize better than complex models, there is increasing evidence that the trade-off between accuracy and interpretability may be less severe than we thought, and the concept of understanding can be used to refer to the feeling of having made sense of something (interpret) or having accounted for observing regularities (predict).
Descriptive modeling is the third type of modeling. Its objective is to summarize and represent the data compactly. The difference with explanatory modeling is that the underlying causal implications are absent or incorporated less formally in these models. On the other hand, compared with predictive modeling, descriptive modeling does not aim to generate a prediction of future values. A typical example of this situation would be when we stumble upon scientific papers whose main objective is to fit the best regression model to capture the association between dependent and independent variables rather than produce causal inferences or predictions. I want to add that even though there is a group of well-defined statistical techniques to make causal inferences, we can find an important number of social science papers that, without claiming causation, show association based on theoretical grounds (explanation). The common phrase “correlation is not causation” clarifies that path, regression, or structural equation models (SEM) do not necessarily allow us to compute the causal effect between variables in the statistical sense. Still, they do present an explanatory association within the model. No standard rule exists to determine whether a social science paper develops an explanatory or descriptive model. Still, in general, the presence of path analysis or SEM diagrams indicates the existence of relational (sometimes causal) implications derived from theoretical reasoning.
As I mentioned at the beginning of this post, I will explain a set of methods to serve as an introduction for researchers interested in learning analytical tools that can be used to develop explanations and predictions in social sciences. The methods I collected originated in different areas, such as causal inference, time series analysis, and information theory. In Table 1, I present a summary of the essential elements of each method.
| Method | Explain or predict | Variable type | # of variables | Stationarity |
|---|---|---|---|---|
| Structural Causal Modeling | Explain | Numerical/Categorical | Many | No |
| Instrumental Variable | Explain | Numerical | Many | No |
| Granger Causality | Explain/Predict | Numerical | Two | Yes |
| Transfer Entropy | Explain/Predict | Categorical | Two | Yes |
| Modes Information Flow | Explain | Categorical | Two | Yes |
| ε-Machines | Predict | Categorical | One | Yes |
| ARIMA models | Predict | Numerical | One | Yes |
Table 1: Methods Summary
While column 2 in Table 1 shows a classification based on the main concepts I have discussed in this post, I also add more information in columns 3 to 5. For the cases of columns 3 and 4, the classification is straightforward, but I would like to define stationarity in case you are not familiar with the term of column 5.
From the list of methods that need stationarity in their data, we can classify Granger Causality and ARIMA models as methods used to make time series analysis. At the same time, Transfer Entropy, Modes of Information Flow, and epsilon-Machines are analytical tools of Information Theory. For all the previously mentioned methods, the data need a temporal structure, meaning that we have a succession of data points of the form \( t_1, t_2, t_3, … \) called time series. Intuitively, stationarity implies that a time series’ statistical properties do not change over time. A practical weak-sense of stationarity only requires that the mean and variance do not change over time. Since stationarity is a necessary assumption of different methods, some techniques allow us to transform non-stationarity data into stationarity. These details will be discussed when needed in the following posts for each method.
Now that I have introduced the main concepts of explanation and prediction and how they have been developed and understood in social sciences. I will move forward with the introduction of methods in the following posts. I argue that with the proper comprehension of the virtues and limitations of each analytical tool described, the analysis of research questions in social sciences can be enriched.
References
Brady, H. E. (2011). Causation and Explanation in Social Science. Oxford University Press. https://doi.org/10.1093/oxfordhb/9780199604456.013.0049
Chaffee, S. H. (1991). Explication. Thousand Oaks, CA: Sage.
Hofman, J. M., Sharma, A., & Watts, D. J. (2017). Prediction and explanation in social systems. Science, 355(6324), 486–488. https://doi.org/10.1126/science.aal3856
Shmueli, G. (2010). To Explain or to Predict? Statistical Science, 25(3), 289–310. https://doi.org/10.1214/10-STS330